Sunday, 3 November 2019

Mostly Closest Planet


It has been over 3.5 years since I last updated this dead blog. But I was inspired by a recent video by CGP Grey on Youtube. Here I answer his question with simulation and using data. His video can be found here: https://www.youtube.com/watch?v=SumDHcnCRuU 

What is the closest planet to the Earth? It's a question with answers that vary from Venus or Mars. While true that these are the planets that get closest to the Earth with Venus getting as close as 38M km at opposition. Mars gets as close as 58M km at opposition. However what planet is closest to the Earth on average? The answer is surprisingly Mercury. This is due to the fact that Mercury is never too far from the Earth. When at conjunction both Mars and Venus can be at their semi-major axis plus the semi-major axis of the Earth apart. Whereas Mercury with its short semi-major axis and fast revolutionary period is never too far from the Earth.
Here is a plot of the inner planets. For simplicity sake assume all planetary orbits are circular with zero eccentricity and nil tilt in the orbital plane. Both of which are reasonable assumptions. Mercury does have a large precession due to the curvature of space in the Sun's vicinity however I'll ignore that here and it won't change the results dramatically. To plot these orbits I plotted them on the complex plane. The vertical axis is actually the complex component the function I used to plot the orbit. For each orbit I used the equation r*e^(2*pi*i/T), where r is the orbital semi major axis and T is the orbital period.  


Here I took the differences between the orbit of Earth and the other inner planets. Notice that the curves are not sinusoidal, this is because the distance changes rapidly when the planets are approaching opposition and when at conjunction the orbital distance changes slowly. The dashed line is the average distance between the planets. We can see here that Mercury has the closest average distance from the Earth. 

Unsurprisingly here is the distance between Mercury and the other inner planets. Earth does get closer than Venus to Mercury however there is nothing interesting here as the distance between the other planets and Mercury is as expected. 

 Likewise for Venus and the other planets Mercury is the closest


Now lets have a look at the outer planets. Here are the orbits for scale of the gas giants. 

Now we can plot the difference between the Jupiter and the other planets. Unsurprisingly Saturn, Uranus and Neptune follow each other in average distance from Jupiter. However the inner planets are hard to see at this scale. 

Zooming in and adjusting the time to a few years we can see that once again Mercury is on average the closest planet to Jupiter. Now lets see what happens if we look at Neptune. 
The time is now in centuries this is accounting for Neptune's 165 year orbital period. Uranus is the closest planet that ever makes an approach to Neptune when the two planets are at opposition. The higher frequency curves of the other planets is attributed to their faster orbital speeds and catching up and surpassing Neptune once in their orbit. Jupiter's curve has a period of roughly 10 years which is its orbital period. Zooming in to look at the inner planets we have the following.

Once again the average distance is depicted but the dashed line. It is hard to see here which planet is the closest to Neptune on average. However Mercury just edges out the others. Venus and Earth are not very far apart. The average distance between Mercury and Neptune is essentially its semi major axis. Which is almost the average distance between Venus and Neptune as well as Earth and Neptune. This means for planets which are sufficiently far away and as a result will have a slower orbital period the average distance is approximately the semi major axis of the orbit of the larger planet. To determine if Mercury is in fact the closest planet to Neptune on average a more robust simulation accounting for precession, orbital eccentricity and inclination should be done. I will not do such a calculation as such an endeavour is quite complex. 

Saturday, 18 June 2016

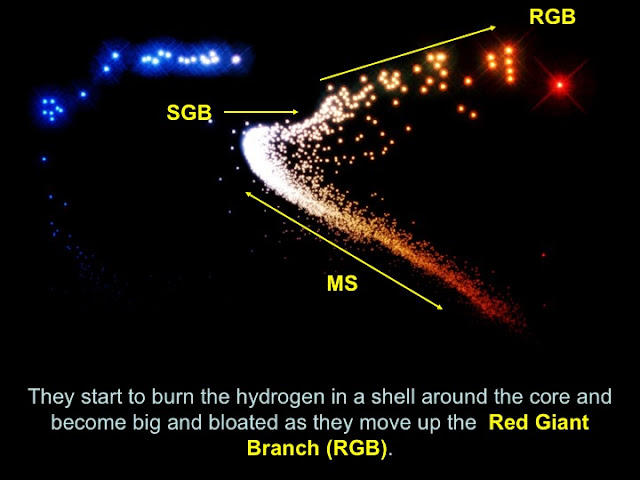
Creating a Colour-Magnitude-Diagram

In graduate school one of the things I spent a lot of my time on was creating colour-magnitude-diagrams (CMDs). These diagrams are extremely useful in studying stellar populations, making models of stellar evolution and for use as redundancy in cross checking other theories in astronomy. Below is a post of my first reddit post that was extremely well received and made the front page of reddit. The reddit post is here.

Saturday, 20 February 2016

Rodgers to Rodgers

Aaron Rodgers is good, but how good is he? Well the has one of the best arms in the game and he threw two last second Hail Marys in one season to send the game to overtime. Below is the first one, a last second pass to Richard Rodgers against the Detroit Lions.


To throw the football that far you need some serious arm strength and accuracy. In the pass he threw the ball 67 yards and the hang time was 4.1 seconds. With this in mind its possible to calculate the horizontal and vertical velocities. The horizontal velocity is vx = 60.26m/4.1s = 14.9m/s. The vertical velocity is v = gt/2 = 20.1 m/s. This gives an actual velocity of 25m/s or 90km/hr. 

Next find the angle at which he threw the ball. From the above picture the angle I measured was 53 degrees. With all of this in mind now plug into kinematics equations to work out a graph of the height of the football and downfield distance. 


From here its clear that Rodgers had to throw the football at a 53 degree angle, if he miscalculated the angle by just 5 degrees the ball would have landed just 63 yards downfield; four yards outside of the endzone. If he had thrown the football at 45 degrees to get maximum distance the ball would have travelled 70 yards down the field and ended up in the back of the endzone where no receivers were present. The kinetic energy of the pass was about 135J which is the same as a baseball pitcher's fastball going at 100mph. 


But what if somehow Rodgers had magically ended up on the Moon as he was about to launch the football?


On the Moon the acceleration due to gravity is just 1/6th that on the Earth. If Rodgers threw the football with same force and angle the football would have ended up landing 410 yards away and reached a maximum height of 120 meters. So how good is Aaron Rodgers? Probably the best quarterback in the sport that can not only throw a football very far but also very accurately. 


Friday, 12 February 2016

Gravitational Orbit Decay

So the detection of gravitational waves was announced yesterday. Its quite an amazing detection and will usher in a new age of astronomy. The waves were detected from the collision of two black holes, as they spiraled in towards each other they emitted the energy equivalent of about 3 solar masses of gravitational radiation. We know that black holes and neutron stars in binary systems will one day spiral inwards and undergo a collision, but what about our solar system? Obviously the solar system's lifetime will not permit any planet or satellite of a planet to undergo orbital decay from gravitational forces. The lifetime of our solar system is on the order of 10 billion years. However, what if the Sun was a black hole and we ignored any external forces, how long would it take some of the planets to undergo gravitational orbital decay? From Einstein's field equations we can get an simple formula that predicts how long it takes for a two body system to collide. I calculated the lifetime of the orbits of Mercury, Venus and Earth as well as the power Each planet emits due to gravitational radiation. Currently the Earth emits just 200W of gravitational radiation compared to the 200 PW (Petawatts 10^15) which is emitted in the form of electromagnetic radiation. 

Orbital time decay and gravitational radiation radiated


Another note is that Mercury and Venus will cross paths likely leading to a collision with each other before they spiral into the Sun. But the most astounding aspect of this is the gargantuan timescales. The horizontal axis is in the order of trillions of billions of years. Basically for the Earth to collide with the Sun the equivalent time of the current age of the universe must pass a quadrillion times. Needless to say this is not going to happen, the only element stable enough in these timescales is Tellurium-128, which has a half life of 2.2*10^24 years. About 22x longer than the orbital decay timescale of the Earth.  This was an interesting calculation, got to see how weak gravity really is.